A single measurement gives a status, a set of values may be an indicator of a change. When a lot of data is available, predictions about future situations are possible.
The frog fable tells us that a frog does not perceive the danger in water that is brought to a boil slowly. If the water temperature is plotted in a simple graph, it is suddenly very clear what happens an d good predictor of the trend.
Measuring values provides interesting insights. Many Mobeye applications are aimed at monitoring specific values. This can concern a specific temperature, an alarm status of an intrusion system, water level, the pressure in a tube, etc. In addition to fault reporting, the values also provide other information, such as the change of a condition. Patterns and deviations help to analyze a system.
The interpretation of an alarm
Mobeye products are often used in situations where monitoring limits goes hand in hand with data analysis and predicting the trend of values.
A water level monitor in a public toilet can primarily be used to know when to refill the clean water tank and to empty the waste water tank. If it turns out that a tank is emptying too fast and the increased use cannot be explained, it may indicate a leak. A fire detector that seems to go off unjustly may also have been triggered by a clandestine smoker in the room.
Patterns and trend analyses
If the measuring instrument logs values and provides insight with a graph or table, data analysis will provide even more information. In addition to patterns, trend analyses provide a insights in the status and even become a predictor of the future. A temperature in a refrigerator that rises quickly can indicate a malfunction, an open door, or a power failure. However, if the temperature rises slowly, it may indicate the end of the refrigerator’s life. The temperature measured in the middle of a pile of stored powder can prevent an explosion. In such a case a trend graph, with alarm limits, is a good predictor.
Action through insight
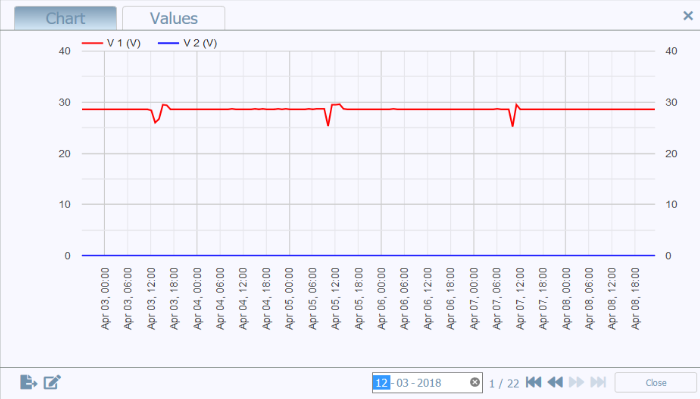
Battery voltage measurements indicate the voltage development. A too low voltage can lead to a defective battery, which is prevented by automatically switching off the battery. The voltage variation gives an indication of the health of the battery. Deflating too quickly gives unreliable operation and requires repair or replacement. And in specific situations, such as with electric vessels, the analysis of the voltage development provides insight into the use. A rental company that sees that the battery is being drained too quickly can can hold the renter accountable for sailing behavior.
Maintenance scheduling
Monitoring the pressure in vacuum tubes provides insight into the airtightness of the wall of the tubes. By looking at the rising pressure in the trend chart, maintenance can be planned accurately. This gives the opportunity to carry out the work efficiently. By not only looking at alarm limits but also at the trend, maintenance can be pulled forward and can therefore be combined with, for example, urgent maintenance of neighboring installations.
Do you want to analyse or predict the state of a system based on data analysis?
We are happy to think along with you.